Setup your scenario
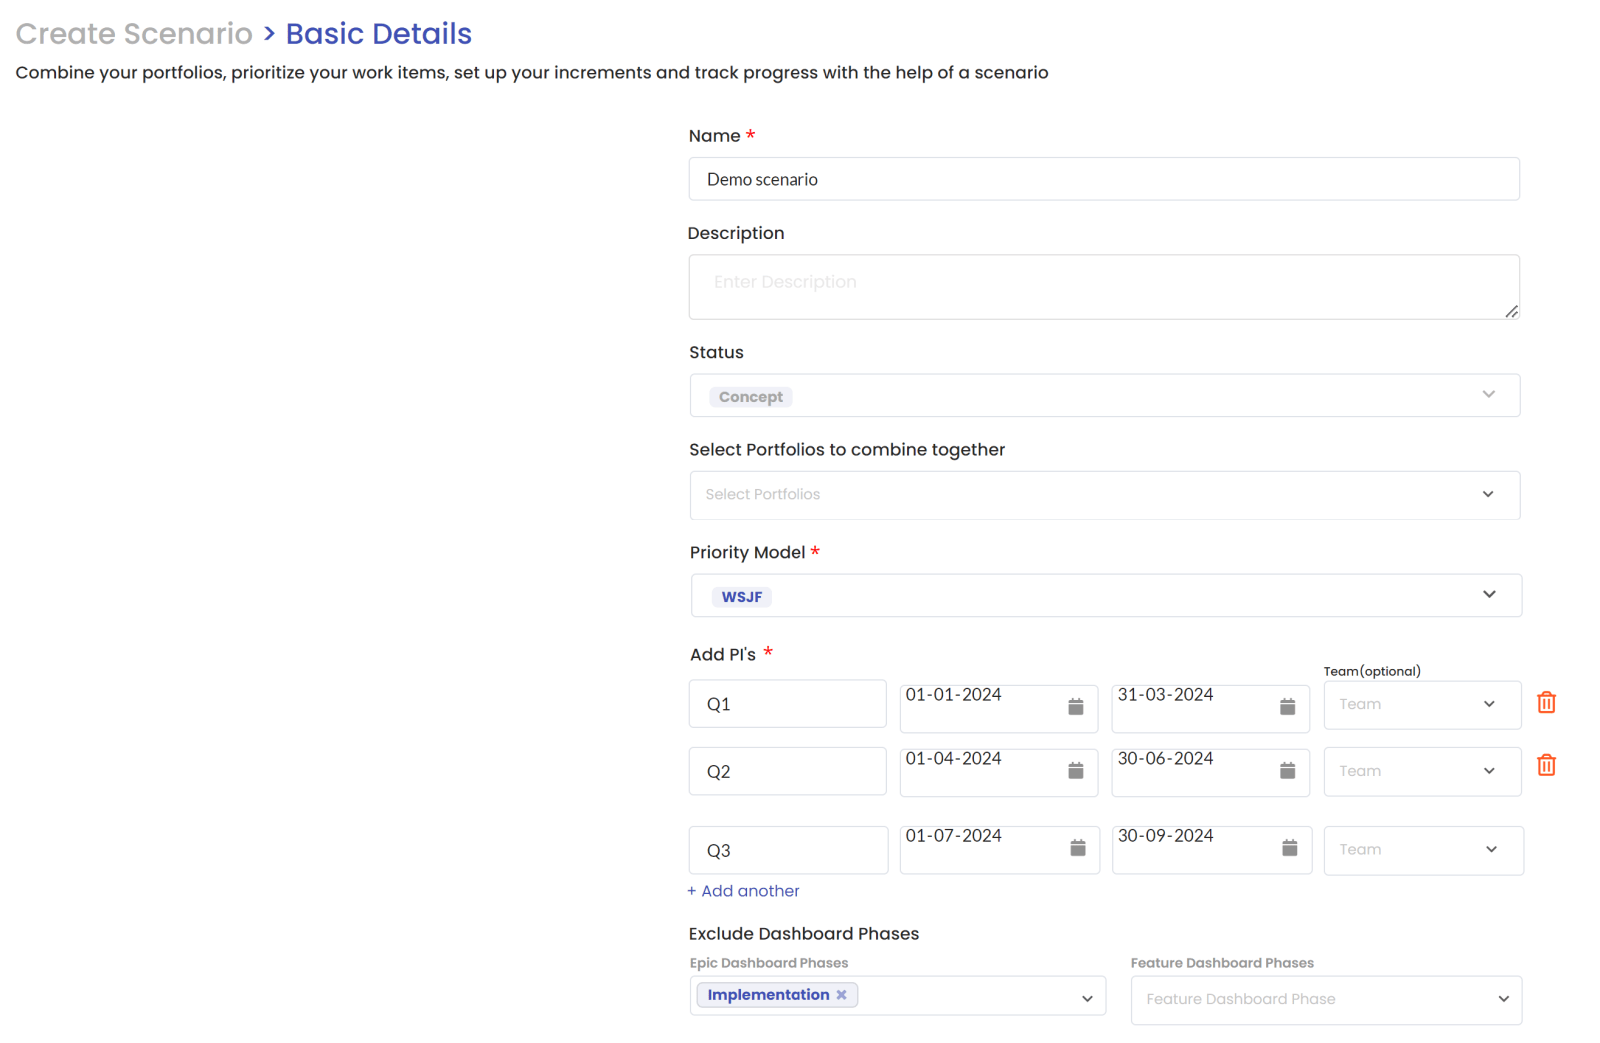
To start your scenario, you will create a new scenario in the section Planning/ Create Scenario. You can find earlier created scenarios via the dropdown menu or via Manage Scenarios.
Once you create a new scenario, you will be asked for the settings of your scenario:
- Name and description of your scenario
- Selection of multiple portfolios (you can create scenarios in which you add the data of multiple portfolios)
- The priority model that you want to use for your scenario
- The PI’s you want to use in your scenario including start and end date of the PI’s
- Exclusion of dashboard phases (you can choose to exclude certain dashboard phases of your scenario)
The scenario will contain a dashboard, prioritization screen and a roadmap. Everything that you will change in the scenario will remain in the scenario until you finalize and publish the scenario.
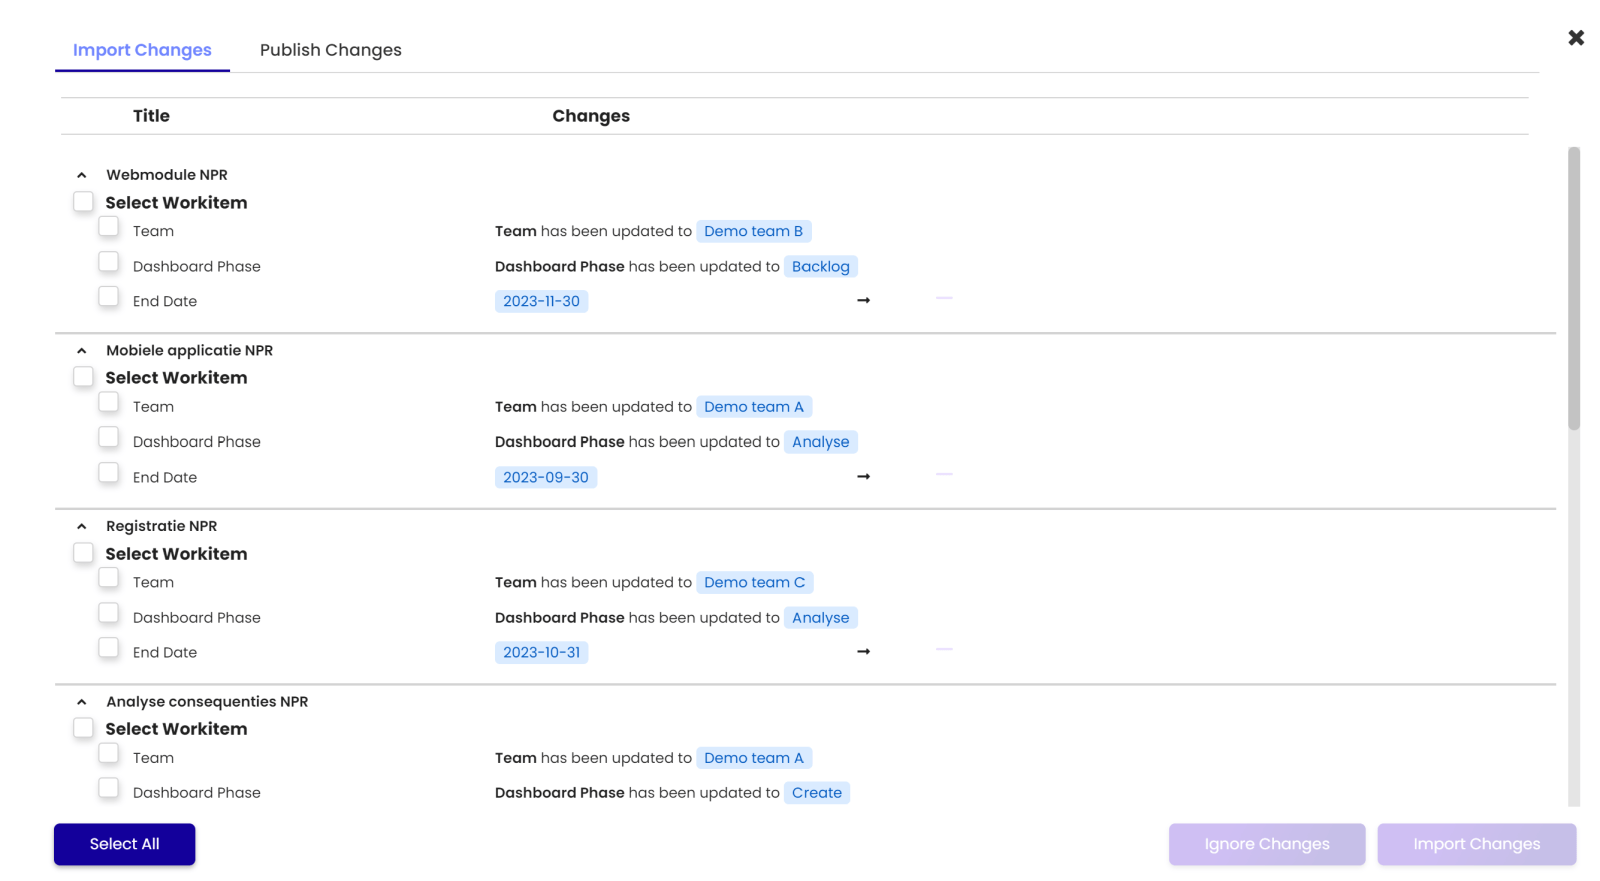
Changes that are made in your integration Azure DevOps or Jira account after you have set up your scenario, will not be considered in your scenario unless you import these changes. You can see which changes can be imported via the Changes icon.
Dashboard
The dashboard visualizes how your work items are divided in your funnel. You can use filters to decide what you want to see in your dashboard.
There are 2 dashboards available:
- The epic dashboard
- Feature dashboard
The dashboard has 2 different views:
- Goal view/ Epic view: the work items shown based on the linked strategic goal or the linked epic.
- Value stream view: the work items are shown based on the linked value stream.

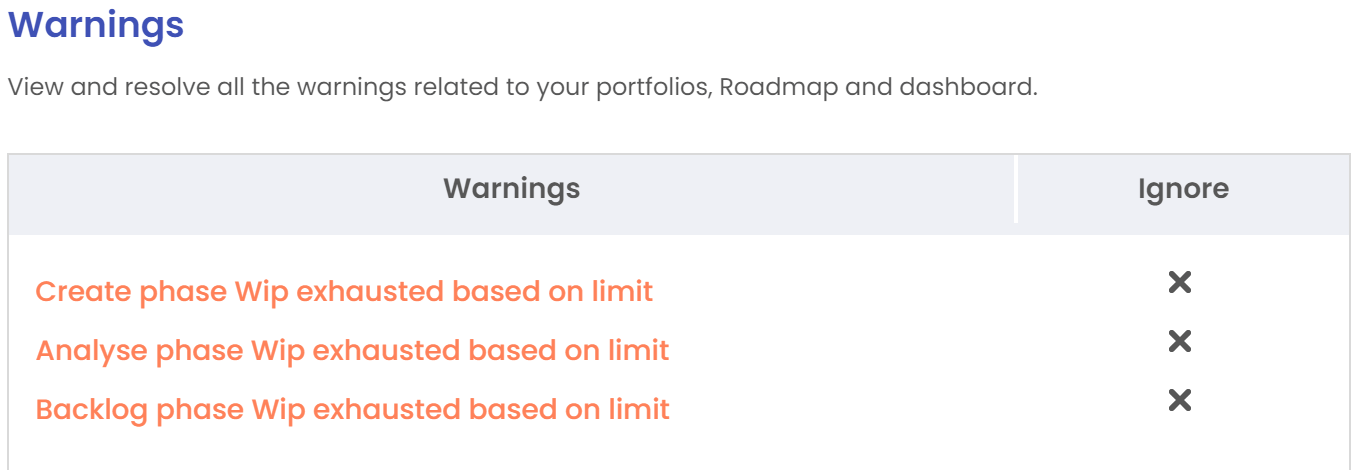
If you have set up the WIP limit in the section settings, you can see warnings based on the WIP limit in the dashboard.
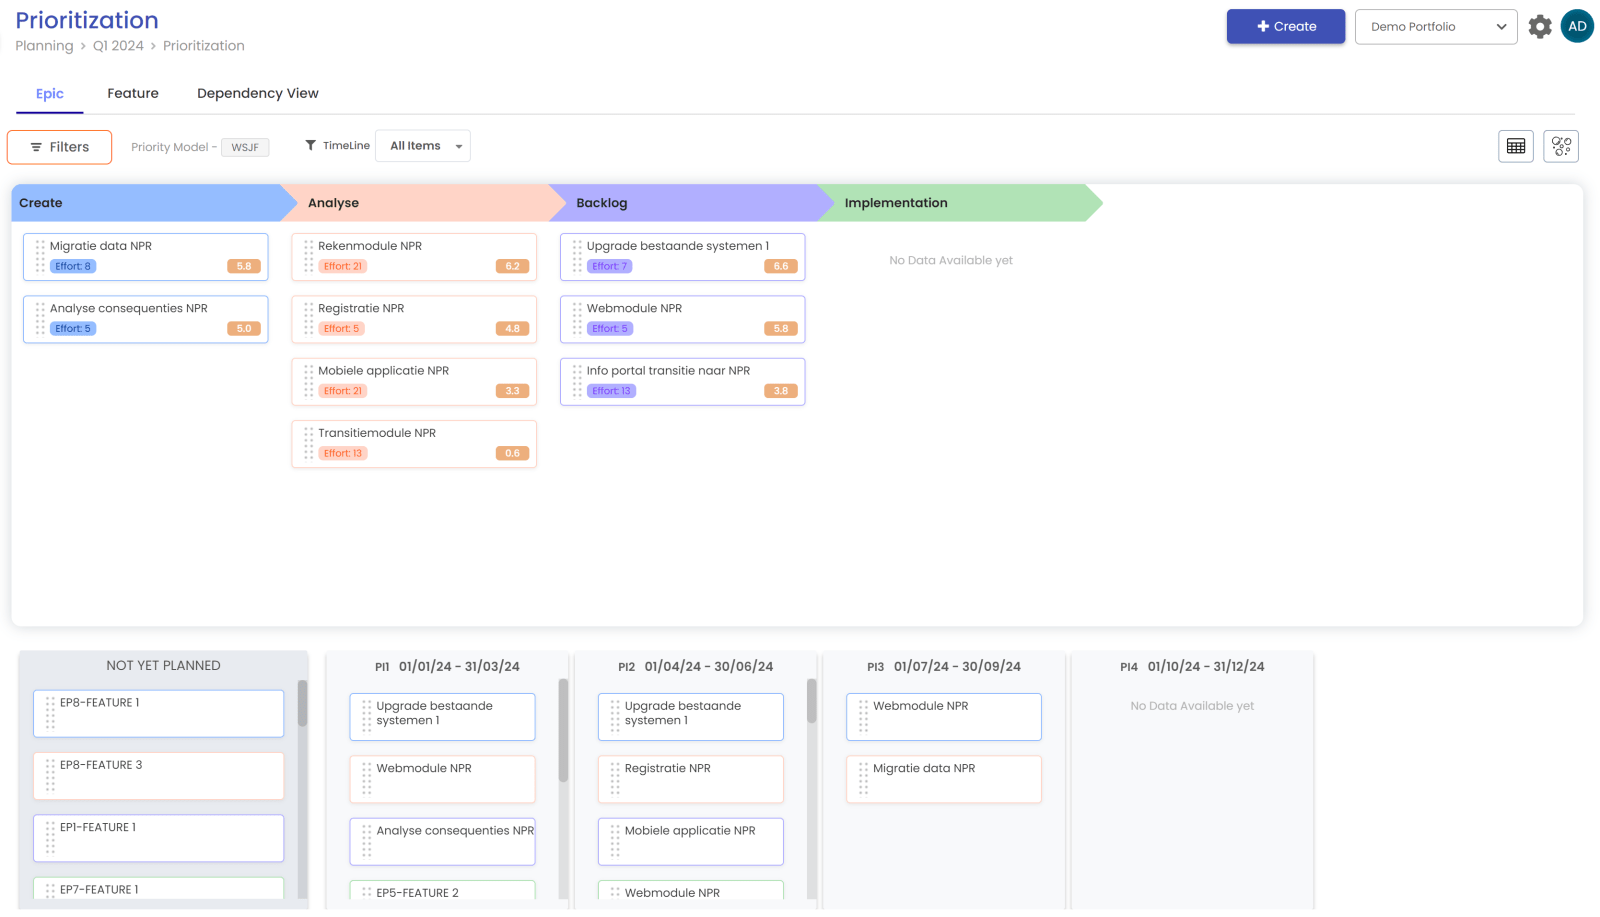
Prioritization
With the prioritization screen, you can determine the priorities within your portfolio. Based on your chosen prioritization model, you will score each work item. Based on the given values, a priority ranking will be created.
You can use the filters to determine which part of your portfolio you want to prioritize. The prioritization can be done on epics and on features. In the epic tab, you will see the linked features. In the feature screen you can choose to show the list based on the linked epic. If the prioritization on epic level is already made, the order of the feature list will be the same in the feature tab.


Once you have set up the ranking, you can choose which items you want to add to the roadmap via the Add to timeline icon. If you want to delete it from the Roadmap, you can click again on the icon.

You can choose to visualize your prioritization in 2 screens:
- Funnel view
- Bubble view
Funnel view
The funnel view can be used to visualize where the work items are in the dashboard. You can already make a high over mapping to PIs by drag and drop them in the desired PI.
Bubble view
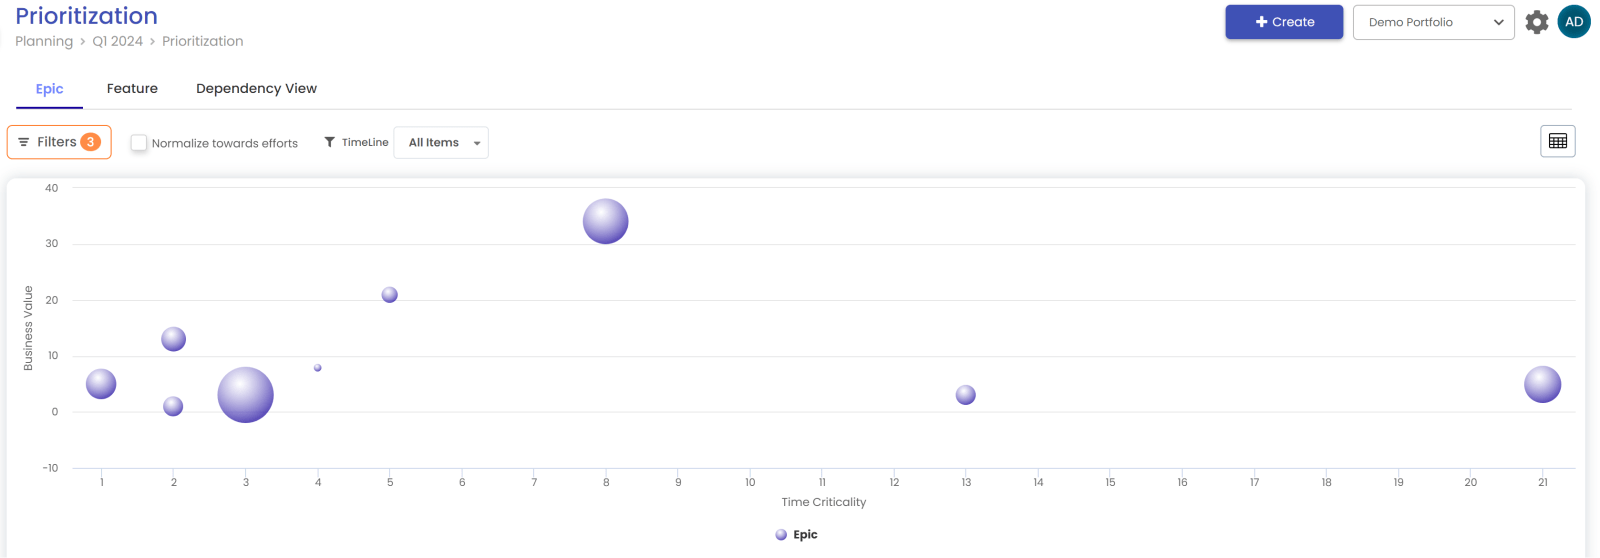
The bubble view can be used to visualize the values of the different categories. You can choose per axis which data you want add. You choose the axis in the section Filters.
Roadmap
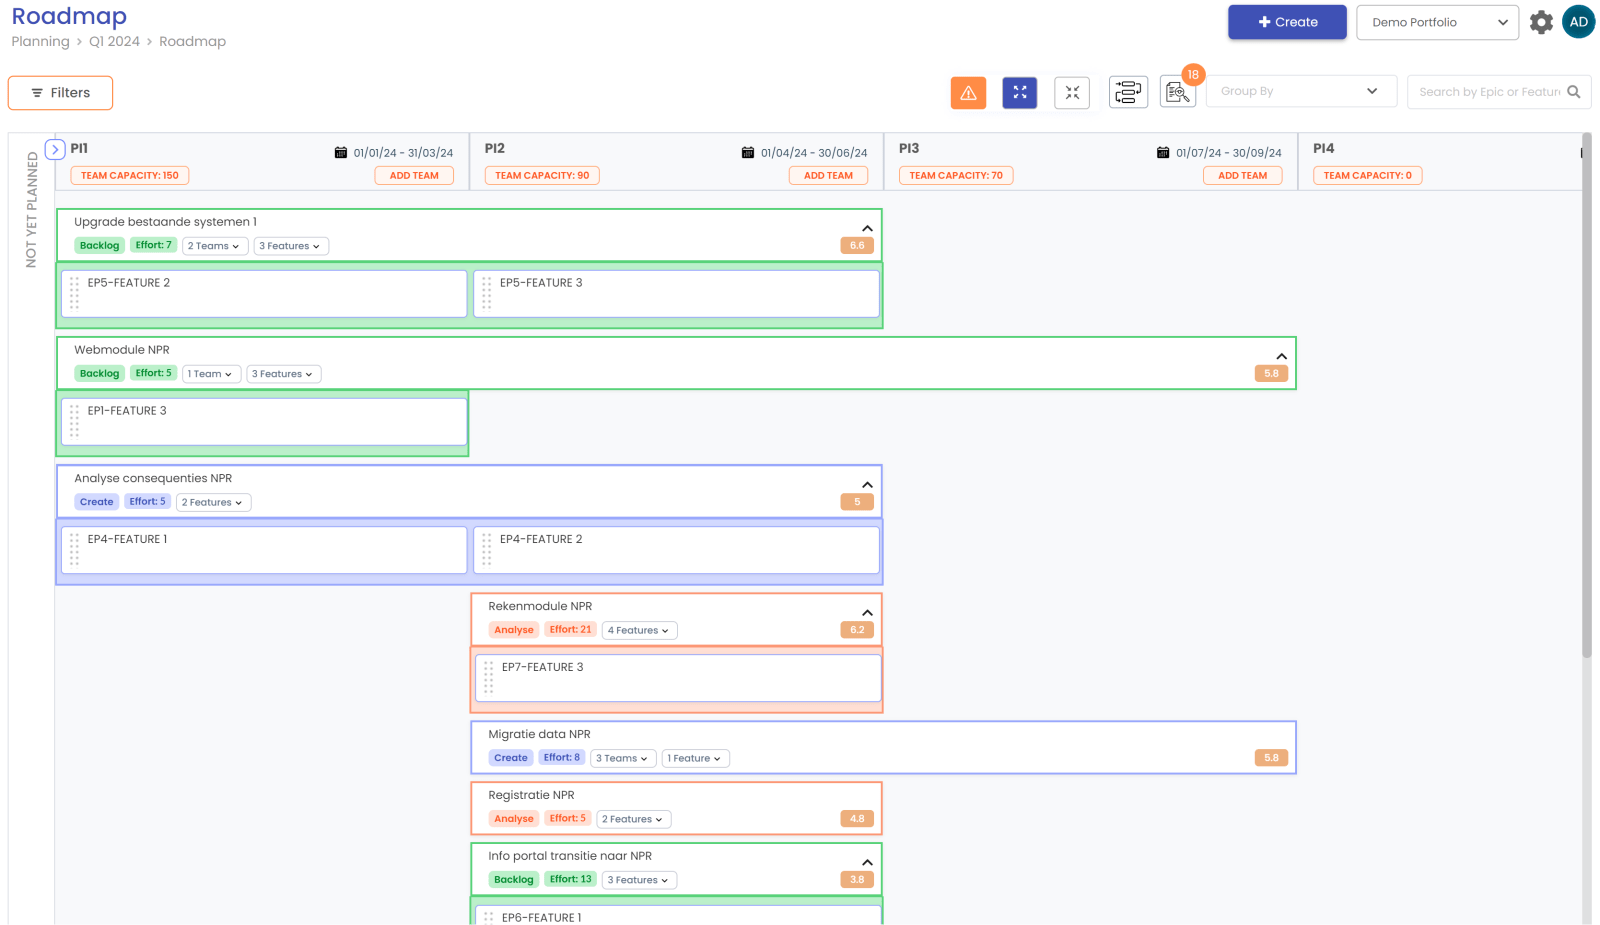
All work items selected in the prioritization screen are visible in the roadmap and can be mapped to the different PI’s. You can map them to the right PI via drag and drop. If a work item takes more then one PI you can extend the work item over different PI’s.
You can use the filters or the group by option to determine how you want to show the roadmap.
The dependencies are also synced with ADO. If any dependency is created in ADO/Cockpit, it will sync automatically to the other system.
The synced dependency can only deleted from ADO.
Dependencies
The funnel view can be used to visualize where the work items are in the dashboard. You can already make a high over mapping to PIs by drag and drop them in the desired PI.ou can determine the risk within your planning by showing the dependencies between the work items. You can drag the lines between the different work items. In the pop up you can add the details of the dependency. You will also find this information in the work item statement.


Warnings
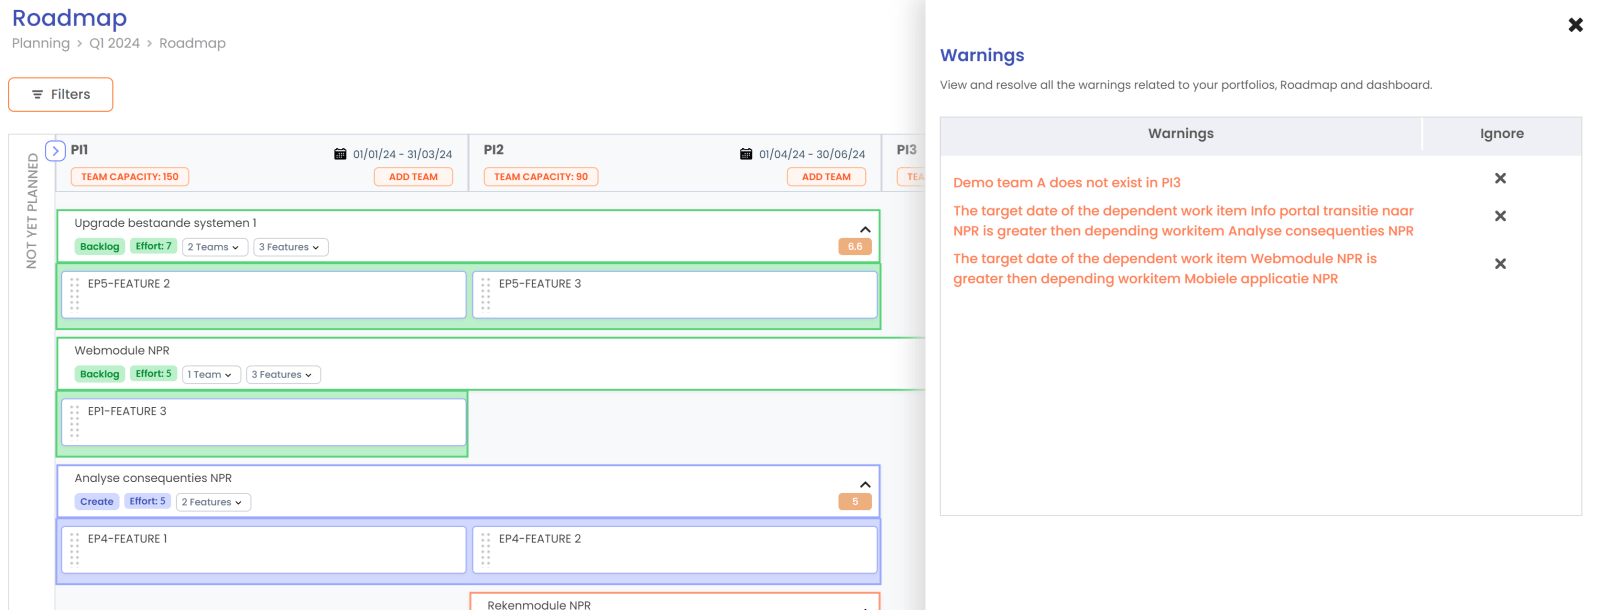
The warnings give you information about the issues in your roadmap. These warnings can be about the dependencies within your roadmap or the available capacity for your PI’s.
Capacity planning
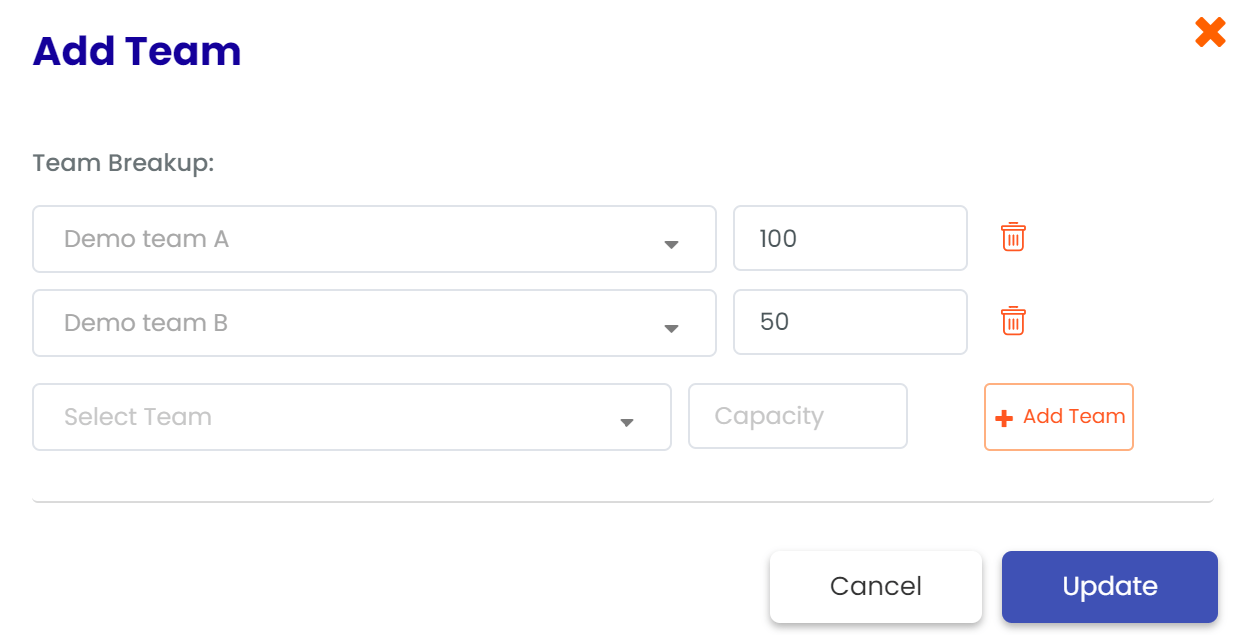
You can add in your roadmap the available capacity of your teams and analyze if you have enough capacity for your plans. If you over plan the capacity you will see a warning in the warning section. You can make your capacity based on the effort type of your prioritization: story points, t-shirt sizes, hours or sprints. You can determine the capacity based on the entire portfolio or per team, based on the setting of your portfolio. If you have work items which are planned over multiple PI’s, the effort is equally divided over the chosen PI’s.
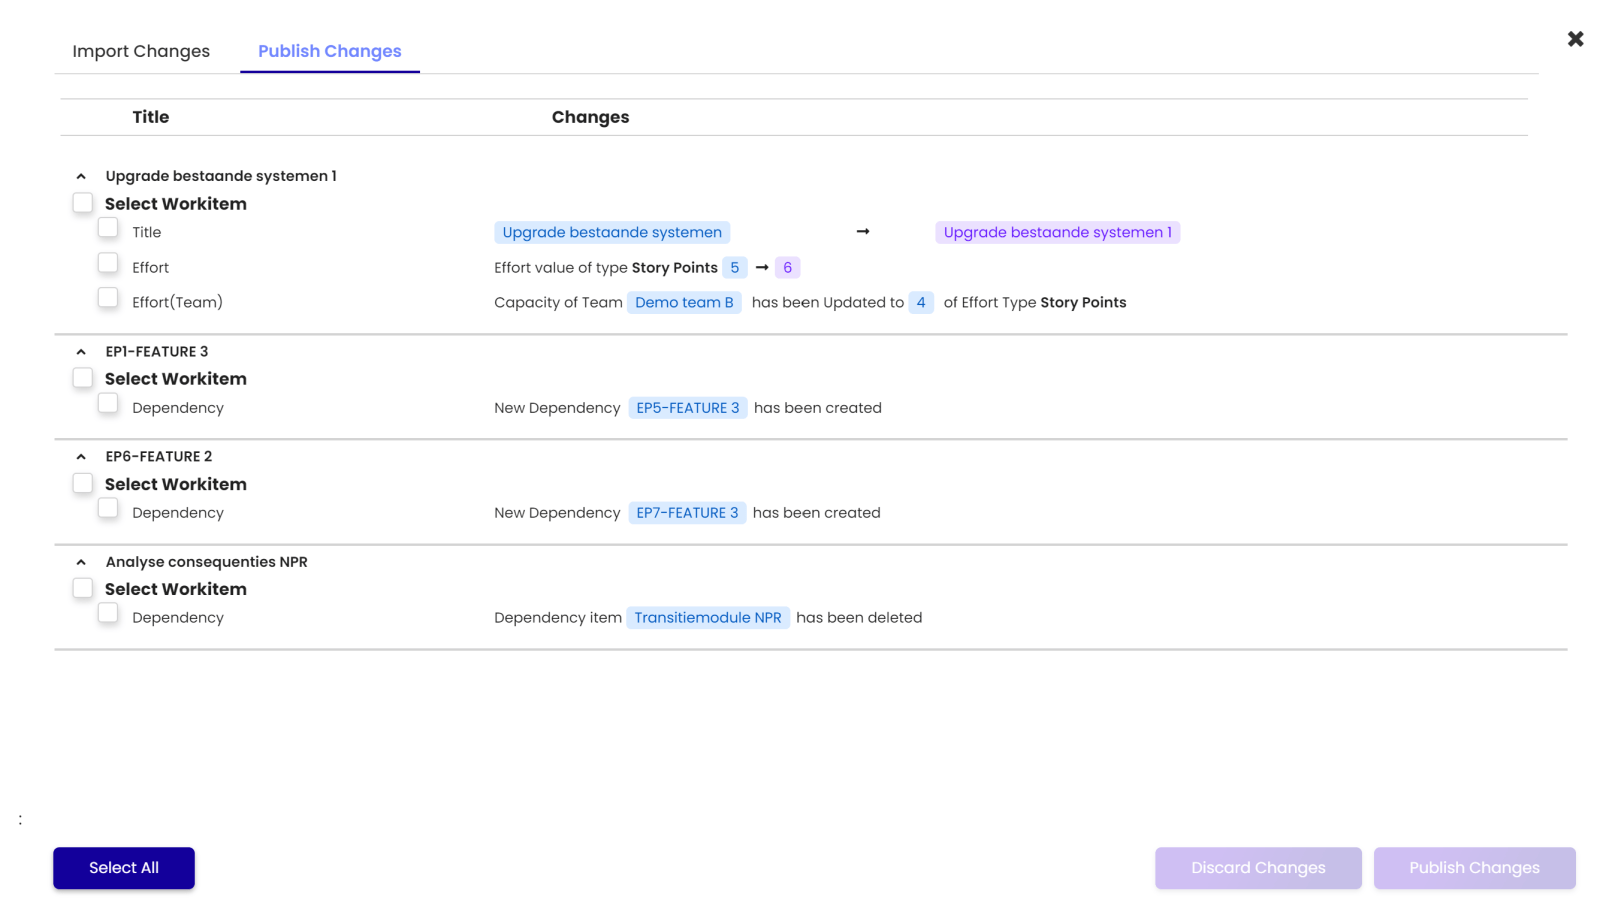
Publish changes
Once you have finalized your scenario, you can publish the scenario. You can select which changes you want to publish or which changes you want to discard. Once you have published the changes, the work items in the section Manage/Work item will be updated. Also your integrated Azure DevOps or Jira account will be updated with the new data.
Setup your scenario
To start your scenario, you will create a new scenario in the section Planning/ Create Scenario. You can find earlier created scenarios via the dropdown menu or via Manage Scenarios.
Once you create a new scenario, you will be asked for the settings of your scenario:
- Name and description of your scenario
- Selection of multiple portfolios (you can create scenarios in which you add the data of multiple portfolios)
- The priority model that you want to use for your scenario
- The PI’s you want to use in your scenario including start and end date of the PI’s
- Exclusion of dashboard phases (you can choose to exclude certain dashboard phases of your scenario)
The scenario will contain a dashboard, prioritization screen and a roadmap. Everything that you will change in the scenario will remain in the scenario until you finalize and publish the scenario.
Changes that are made in your integration Azure DevOps or Jira account after you have set up your scenario, will not be considered in your scenario unless you import these changes. You can see which changes can be imported via the Changes icon.
Dashboard
The dashboard visualizes how your work items are divided in your funnel. You can use filters to decide what you want to see in your dashboard.
There are 2 dashboards available:
- The epic dashboard
- Feature dashboard
The dashboard has 2 different views:
- Goal view/ Epic view: the work items shown based on the linked strategic goal or the linked epic.
- Value stream view: the work items are shown based on the linked value stream.
If you have set up the WIP limit in the section settings, you can see warnings based on the WIP limit in the dashboard.
Prioritization
With the prioritization screen, you can determine the priorities within your portfolio. Based on your chosen prioritization model, you will score each work item. Based on the given values, a priority ranking will be created.
You can use the filters to determine which part of your portfolio you want to prioritize. The prioritization can be done on epics and on features. In the epic tab, you will see the linked features. In the feature screen you can choose to show the list based on the linked epic. If the prioritization on epic level is already made, the order of the feature list will be the same in the feature tab.
Once you have set up the ranking, you can choose which items you want to add to the roadmap via the Add to timeline icon. If you want to delete it from the Roadmap, you can click again on the icon.
You can choose to visualize your prioritization in 2 screens:
- Funnel view
- Bubble view
Funnel view
The funnel view can be used to visualize where the work items are in the dashboard. You can already make a high over mapping to PIs by drag and drop them in the desired PI.
Bubble view
The bubble view can be used to visualize the values of the different categories. You can choose per axis which data you want add. You choose the axis in the section Filters
Roadmap
All work items selected in the prioritization screen are visible in the roadmap and can be mapped to the different PI’s. You can map them to the right PI via drag and drop. If a work item takes more then one PI you can extend the work item over different PI’s.
You can use the filters or the group by option to determine how you want to show the roadmap.
The dependencies are also synced with ADO. If any dependency is created in ADO/Cockpit, it will sync automatically to the other system.
The synced dependency can only deleted from ADO.
Dependencies
The funnel view can be used to visualize where the work items are in the dashboard. You can already make a high over mapping to PIs by drag and drop them in the desired PI.ou can determine the risk within your planning by showing the dependencies between the work items. You can drag the lines between the different work items. In the pop up you can add the details of the dependency. You will also find this information in the work item statement.
Warnings
The warnings give you information about the issues in your roadmap. These warnings can be about the dependencies within your roadmap or the available capacity for your PI’s.
Capacity planning
You can add in your roadmap the available capacity of your teams and analyze if you have enough capacity for your plans. If you over plan the capacity you will see a warning in the warning section. You can make your capacity based on the effort type of your prioritization: story points, t-shirt sizes, hours or sprints. You can determine the capacity based on the entire portfolio or per team, based on the setting of your portfolio. If you have work items which are planned over multiple PI’s, the effort is equally divided over the chosen PI’s.
Publish changes
Once you have finalized your scenario, you can publish the scenario. You can select which changes you want to publish or which changes you want to discard. Once you have published the changes, the work items in the section Manage/Work item will be updated. Also your integrated Azure DevOps or Jira account will be updated with the new data.